Overview
Browser Use has a native integration with Laminar - open-source platform for monitoring and analyzing error patterns in AI agents. Laminar SDK automatically captures agent execution steps, costs and browser session recordings of Browser Use agent. Browser session recordings allow developers to see full video replay of the browser session, which is useful for debugging Browser Use agent.Setup
Install Laminar python SDK.LMNR_PROJECT_API_KEY environment variable.
Usage
Initialize Laminar at the top of your project, and both Browser Use agent traces and session recordings will be automatically captured.Viewing Traces
You can view traces in the Laminar UI by going to the traces tab in your project. When you select a trace, you can see both the browser session recording and the agent execution steps. Timeline of the browser session is synced with the agent execution steps. In the trace view, you can also see the agent’s current step, the tool it is using, and the tool’s input and output.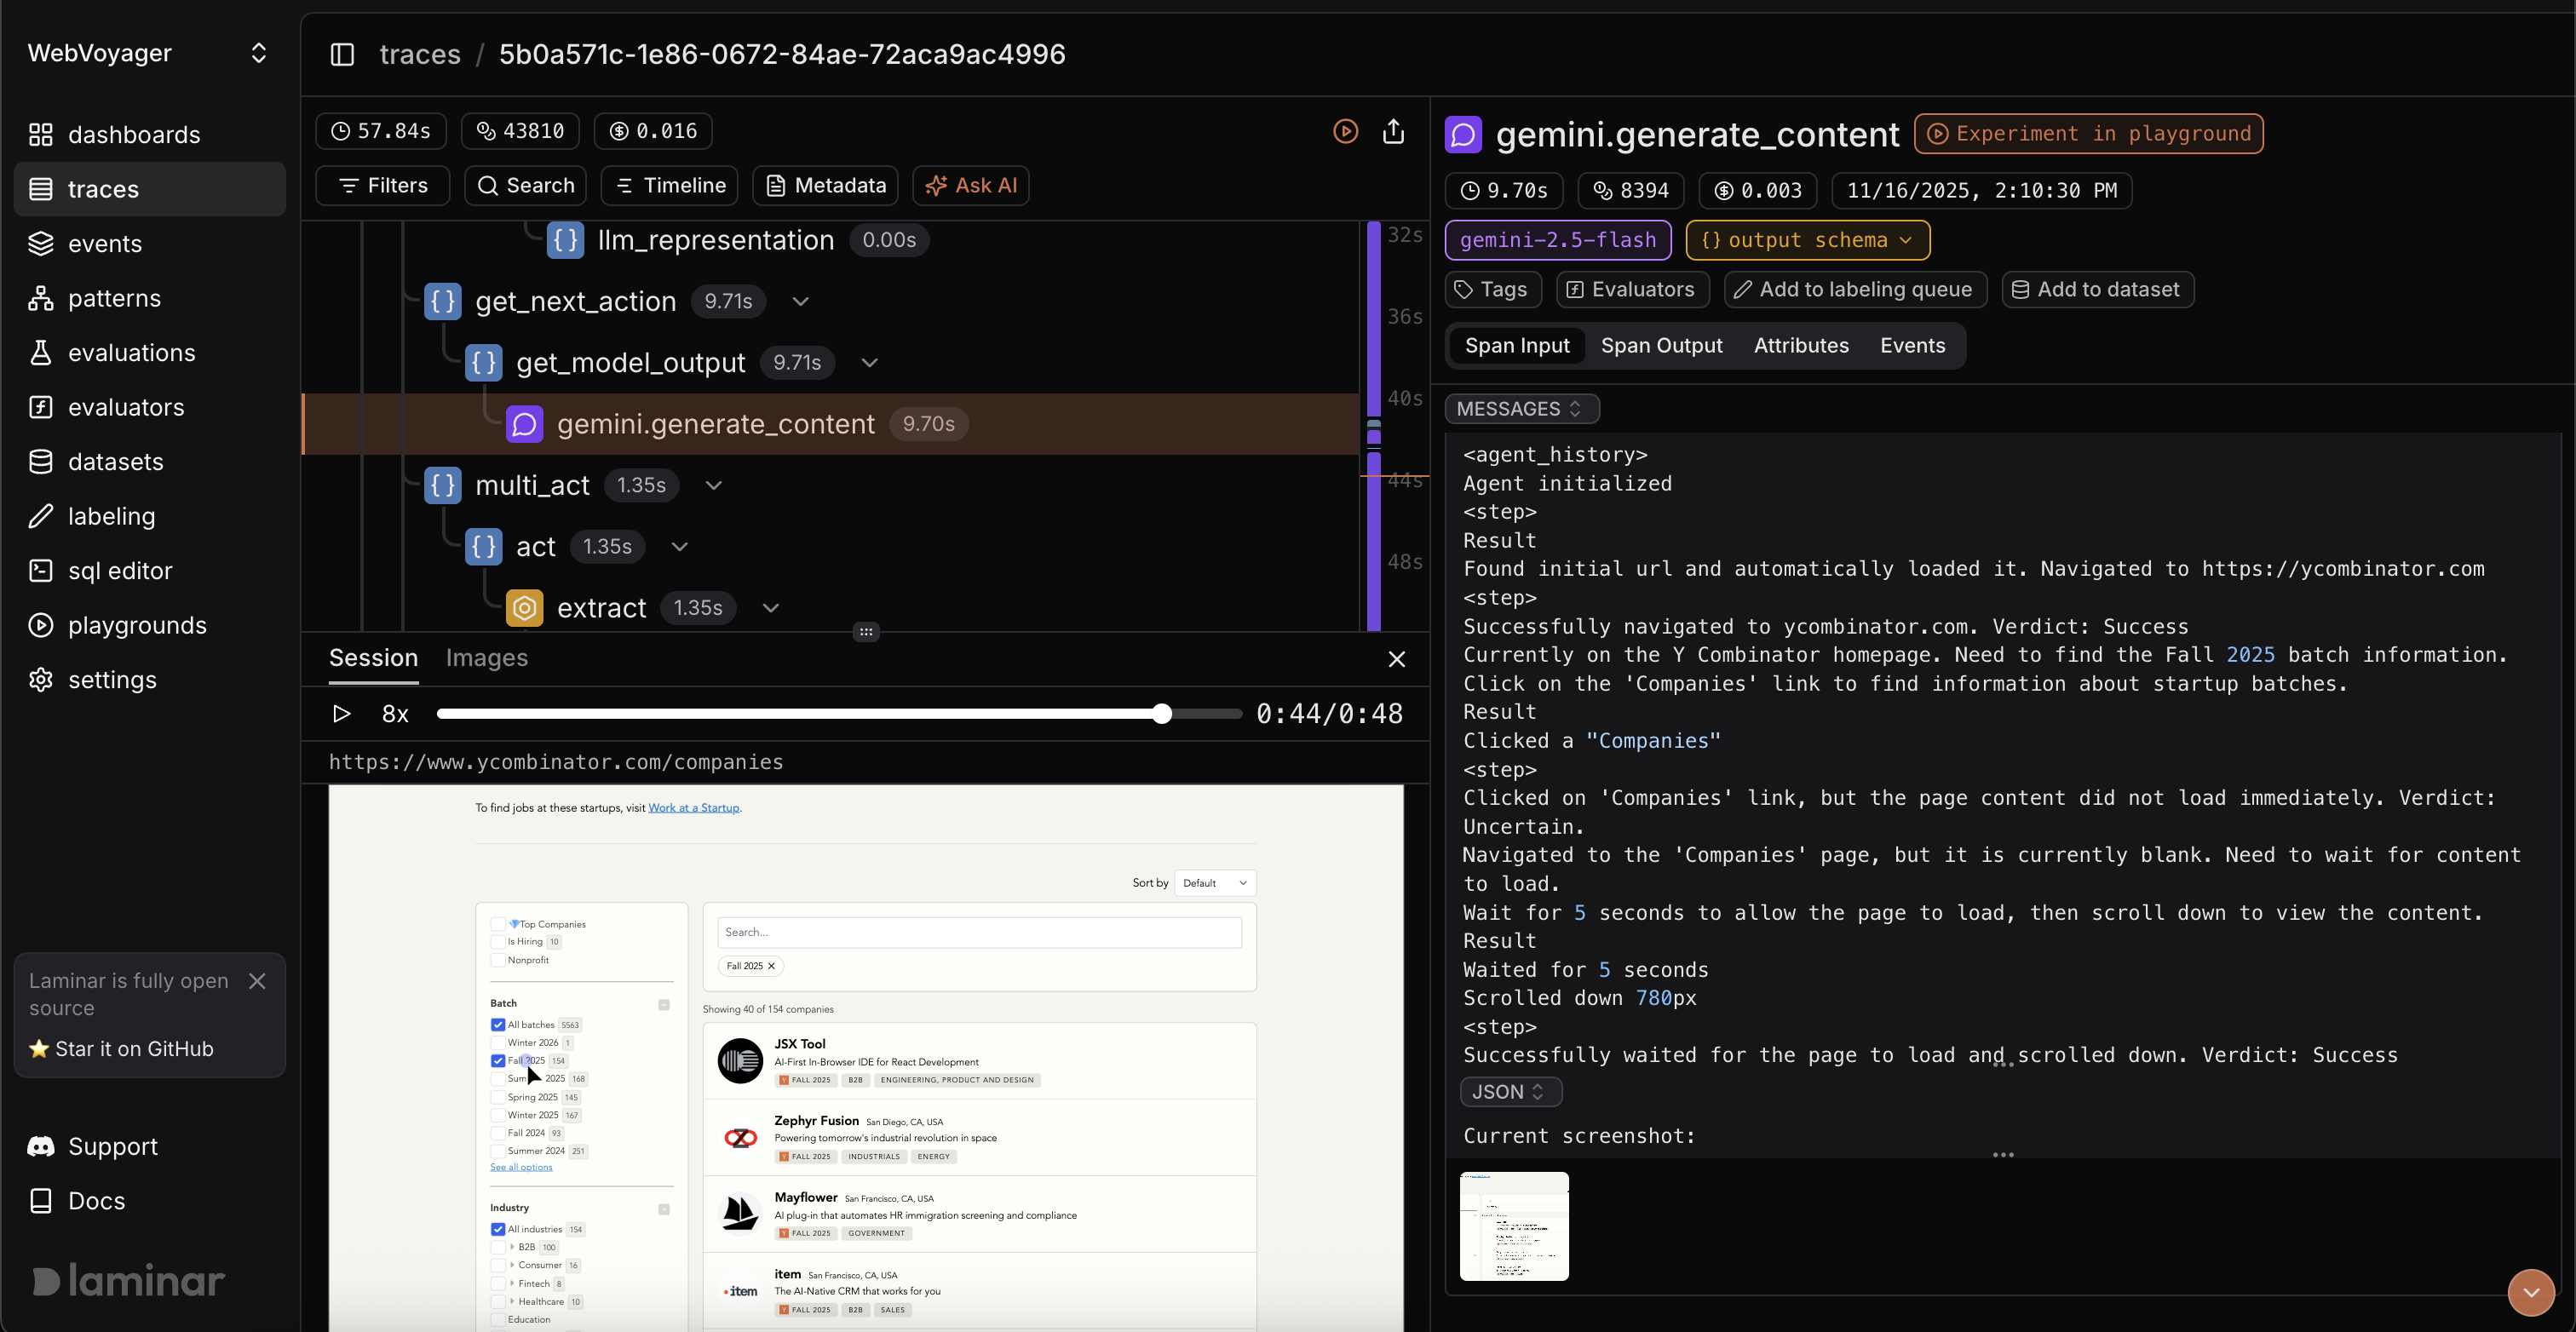
Laminar
To learn more about how you can trace and evaluate your Browser Use agent with Laminar, check out Laminar docs.Browser Use Cloud Authentication
Browser Use can sync your agent runs to the cloud for easy viewing and sharing. Authentication is required to protect your data.Quick Setup
export BROWSER_USE_CLOUD_SYNC=true.